
[Ep 7] PHASE 4: Funnel Analysis
- Aug 18, 2025
- 12 min read
Updated: Sep 1, 2025
Where the fun really begins.
The model was connected. I thought I’d beaten the boss level.
Nope.
That was just the warm-up. All I’d really done was unlock another rabbit hole — and somewhere along the way, I’d become Alice.
But this was the good kind of rabbit hole.
The one where the deeper you go, the more the numbers start talking back.
Once you’re in Power BI, three loops pull you in:
The Questions – What do we really need to know?
The Math – How do we calculate it?
The Story – How do we turn numbers into decisions?
The Questions — What do we really need to know?
Here’s how I break them down into five pillars.
1. Customer Analysis — Who’s actually buying?
Who are our customers by gender, age, and location?
How many loyalty members — and how do they split across tiers?
Average loyalty balance, visit frequency, and membership length.
Segment behaviour — do certain tiers, cities, or age groups spend or visit more?
Contact data completeness — because missing emails and phones kill campaign reach.
Demographic hot spots — are certain age groups or genders more common (and more valuable) in specific locations?
New member journey — how fast do they make their first purchase, and early points earned.
New vs. returning traffic — which is driving growth?
RFM analysis — recency, frequency, monetary value.
Why it matters: These patterns drive targeting, messaging, and retention strategy. It’s not just about who buys — it’s about how often and under what conditions.
2. Sales Performance & Trends — How much you sell and how fast?
Total sales & transactions (monthly, quarterly, annually).
Growth trends — daily, weekly, monthly, annual peaks.
Seasonal swings tied to holidays, weather, events.
Payment mix — how your customers prefer to pay: cash, credit, digital.
Store performance — location leaderboard for revenue and volume.
Long-term trends — which stores are growing, stalling, or shrinking.
Day-of-week patterns — which days drive the most revenue at which stores.
Average transaction value — the typical size of a customer’s basket.
Return rate — the true loyalty metric.
Campaign overlap effects — when two promos run at once.
Pro Tip: In a real dashboard, you almost always display both: Count + Total + Percentage. That way you’re telling the complete story: “We had X total customers, Y of them were returning, which equals Z% return rate.”
3. Product Insights — What’s actually selling?
Top products by SKU vs. by product name (these often tell very different stories)
Category leaders — which product categories dominate revenue or volume.
Product mix by store — what sells best where.
Average Price & Quantity — how much people spend per item, and how many they buy per transaction at different locations.
Pro Tip: Always clarify your aggregation level. “Best-selling product” means one thing when it’s SKU-based — where a Chocolate Milkshake (Large) and a Chocolate Milkshake (Small) are counted separately — and another when you’re grouping all variations under a single name. Misreading that can lead to the wrong marketing or stocking decisions.
4. Marketing & Promotions — Which campaigns lifted sales the most?
Campaign ROI — revenue and margin by store and channel.
Segment engagement — which tiers or demographics bite on which offers.
Promo vs. non-promo sales — uplift and margin trade-offs.
Product responsiveness — which items respond best to discounts.
Post-campaign behaviour — do buyers stick around after the deal?
Pro Tip: Always compare both relative impact (percent change) and absolute impact (total dollars or transactions). Marketing loves the first, finance trusts the second.
5. Environmental & Operational Impact — The outside forces
Does weather change buying patterns?
Are some stores better at collecting customer contact data?
Do seasonal events amplify or dampen sales?
Pro Tip: A spike in milkshake sales on hot days is obvious. People tend to go for hot-pot in a cold rainy day.
The Math — How do we calculate it?
This is where the questions turn into formulas.
When working with a team, math can mean different things to different people. A “successful campaign” might mean ROI to a CFO, ROAS to marketing, and net margin to operations.
Since this was a solo project, I set the rules.
But I still documented every formula.
💡 Common trap: Same KPI name, different definition. If one chart’s “Revenue” includes tax and another excludes it, you’ve accidentally created two stories.
My Calculation Matrix
I wanted all my math in one home. So I built a single Calculations table — one place to keep everything tidy, documented, and easy to find later.
Here’s the setup:
Go to: Table tools → New table → name it calculations
Add measures one at a time
Group them by topic so you can find them in seconds
Below is the full list of formulas I used for this project, organized into four key areas — Sales, Customer, Marketing, and Product. Each section is tucked inside its own toggle.
(You can skim this now just to see how it’s organized — then come back when you’re ready to build. These aren’t “textbook perfect,” but they’re tailored for this dataset and calculated as precisely as possible with what I had.)
1. Sales Analysis
Transaction Metrics
Revenue
Total Revenue (in specific time based on slicers)
revenue_total = SUM('w sales_detail_cl'[total_amount_cl])Revenue Lifetime
revenue_lifetime =
CALCULATE(SUM('w sales_detail_cl'[total_amount_cl]),
ALL('w sales_detail_cl'))
Revenue from Current Fiscal Year
revenue_current_fytd = CALCULATE( SUM('w sales_detail_cl'[total_amount_cl]), DATESYTD('w fiscal_calendar_cl'[date], "03-31") — Use the Date column from your dedicated Date table )Revenue from Previous Fiscal Year
revenue_prev_fytd = CALCULATE ( [Total Revenue], DATESYTD ( DATEADD ( 'w fiscal_calendar_cl'[date], -1, YEAR ), "03-31" — Your fiscal year end month and day (MM-DD) ) )Revenue from Current Quarter
revenue_current_qtd = CALCULATE(SUM('w sales_detail_cl'[total_amount_cl]), DATESQTD('w fiscal_calendar_cl'[date]))Revenue from Previous Quarter
revenue_prev_qtd = CALCULATE(SUM('w sales_detail_cl'[total_amount_cl]), DATESQTD(DATEADD('w fiscal_calendar_cl'[date],-1,QUARTER)))Revenue from Current Month
revenue_current_mtd = CALCULATE(SUM('w sales_detail_cl'[total_amount_cl]), DATESMTD('w sales_detail_cl'[sales_date]))Revenue from Previous Month
revenue_prev_mtd = CALCULATE( SUM('w sales_detail_cl'[total_amount_cl]), DATESMTD( DATEADD( 'w fiscal_calendar_cl'[date], -1, MONTH ) — Use the date column from your Date table ) )Revenue per Customer
revenue_per_customer = DIVIDE([revenue_total],[customers_total],0)Revenue per Active Customer
revenue_per_activecustomer= DIVIDE([Total Revenue],[Active Customers])Revenue Same Period Last Year
revenue_sameperiod_lastyear = CALCULATE( [Total Sales], -- Your base measure (e.g., Total Sales) SAMEPERIODLASTYEAR('w fiscal_calendar_cl'[date]) -- Your date column from your calendar table )Transactions
Total Transactions
transaction_total = DISTINCTCOUNT('w sales_detail_cl'[transaction_id])Average Order Value
Average Order Value (AOV) — showing how much customers spend each time they buy, and helps you spot opportunities to increase spend per visit — whether through upselling, bundling, or targeted promotions.
aov_avg_order_value = DIVIDE([revenue_total],[transaction_total],0)ROI

roi = DIVIDE([revenue_total] - ([product_total_cost]+[marketing_totalspend]), [product_total_cost]+[marketing_totalspend], 0)2. Customer Funnel Analysis
General Metrics
Total Customers
customers_total = DISTINCTCOUNT('w customer_profiles_cl'[customer_id])Active Customers(how many customers are active in certain period)
Active Customers (Current Period) = DISTINCTCOUNT('w sales_detail_cl'[customer_id])New Customers In Specific Time
customers_newjoin = DISTINCTCOUNT('w customer_profiles_cl'[customer_id])New Customers In Specific Time (no filter — ie. age group)
customers_newjoin_nofilter = CALCULATE( [customers_newjoin], ALL('w customer_profiles_cl')
-- Use the table where your 'Age Group' column resides
-- If 'Age Group' is a calculated column in 'w sales_detail_cl',
-- use ALL('w sales_detail_cl'[Customer Age Group]) or ALL('w sales_detail_cl') )
Customers Repeating From Previous Month
customers_return_mtd =

VAR customers_current_table
= CALCULATETABLE( VALUES('w sales_detail_cl'[customer_id]), DATESMTD('w fiscal_calendar_cl'[date]) )

VAR customers_prev_mtd_table = CALCULATETABLE( VALUES('w sales_detail_cl'[customer_id]), DATESMTD( DATEADD('w fiscal_calendar_cl'[date], -1, MONTH) ) )

RETURN COUNTROWS( INTERSECT( customers_current_table, customers_prev_mtd_table ) )
Returning Customer Rate (MoM)
customer_returning_rate_mom =
DIVIDE( [customers_return_mtd], -- Number of returning customers this MTD [customers_current_mtd], -- Total active customers this MTD 0 -- Handle division by zero )

-- Format this measure as a Percentage.
RFM Analysis (Recency, Frequency, Monetary)
A classic way to segment customers — and one of the most practical. We score each customer on:
Recency — How recently they purchased
Frequency — How often they purchase
Monetary — How much they spend
Step 1 — Build the RFM Base Table
First, create a calculated table that stores raw R, F, M values for every customer.
Go to "Modeling" tab -> "New table".

RFM_Customers =
SUMMARIZECOLUMNS(
    'w customer_profiles_cl'[customer_id],
    'w customer_profiles_cl'[first_name], -- Assuming you have a customer name
    "LastPurchaseDate", CALCULATE(MAX('w sales_detail_cl'[sales_date])),
    "TotalPurchases", CALCULATE(COUNTROWS('w sales_detail_cl')), -- Count of sales rows
    "TotalMonetary", CALCULATE(SUM('w sales_detail_cl'[total_amount_cl])), -- Assuming sales amount column

    -- Calculate Recency Value (days since last purchase)
    "RecencyValue",
        VAR LastSaleDate = CALCULATE(MAX('w sales_detail_cl'[sales_date]))
        VAR RefDate = MAXX(ALL('w sales_detail_cl'), 'w sales_detail_cl'[sales_date]) -- Latest date in entire sales table
        RETURN IF(ISBLANK(LastSaleDate), BLANK(), DATEDIFF(LastSaleDate, RefDate, DAY)),

    -- Calculate Frequency Value (distinct transactions, if available, otherwise total purchases)
    -- Assuming each row in sales_detail is a unique transaction or you have a transaction_id
    "FrequencyValue", CALCULATE(DISTINCTCOUNT('w sales_detail_cl'[transaction_id])) -- Assuming sales_id_cl is a unique transaction ID
)
Explanation:
Recency_Raw: Days since the AnalysisEndDate to the customer's last purchase.
Frequency_Raw: The total count of unique transactions (transaction_id) for that customer. We use DISTINCTCOUNT because one sales_date might have multiple line items, but we want to count distinct "visits" or "orders."
Monetary_Raw: The sum of all total_amount for that customer.
Step 2 — Assign R, F, M Scores
Turn the raw values into scores (1–5) using quintiles.
Lower Recency = better score.
Higher Frequency/Monetary = better score.
1. Select the RFM_Customers_Raw table in the "Fields" pane.
2. Go to "Table tools" tab -> "New column".
Recency Score

R_Score =
VAR _RecencyValue = 'RFM_Customers'[RecencyValue]
VAR P20 = PERCENTILE.EXC('RFM_Customers'[RecencyValue], 0.20)
VAR P40 = PERCENTILE.EXC('RFM_Customers'[RecencyValue], 0.40)
VAR P60 = PERCENTILE.EXC('RFM_Customers'[RecencyValue], 0.60)
VAR P80 = PERCENTILE.EXC('RFM_Customers'[RecencyValue], 0.80)
RETURN
    SWITCH(
        TRUE(),
        ISBLANK(_RecencyValue), BLANK(), -- Handle customers with no purchases
        _RecencyValue <= P20, 5,
        _RecencyValue <= P40, 4,
        _RecencyValue <= P60, 3,
        _RecencyValue <= P80, 2,
        1
    )
Frequency Score
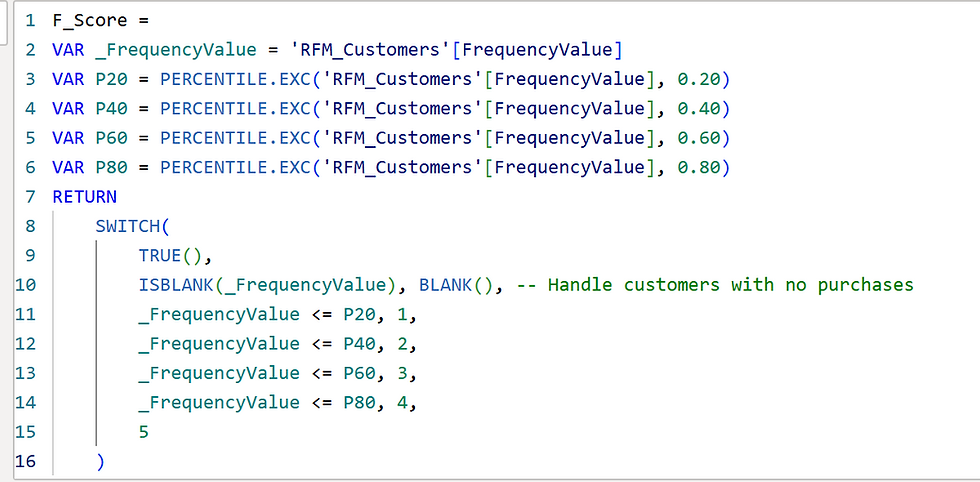
F_Score =
VAR _FrequencyValue = 'RFM_Customers'[FrequencyValue]
VAR P20 = PERCENTILE.EXC('RFM_Customers'[FrequencyValue], 0.20)
VAR P40 = PERCENTILE.EXC('RFM_Customers'[FrequencyValue], 0.40)
VAR P60 = PERCENTILE.EXC('RFM_Customers'[FrequencyValue], 0.60)
VAR P80 = PERCENTILE.EXC('RFM_Customers'[FrequencyValue], 0.80)
RETURN
    SWITCH(
        TRUE(),
        ISBLANK(_FrequencyValue), BLANK(), -- Handle customers with no purchases
        _FrequencyValue <= P20, 1,
        _FrequencyValue <= P40, 2,
        _FrequencyValue <= P60, 3,
        _FrequencyValue <= P80, 4,
        5
    )
Monetary Score

M_Score =
VAR _MonetaryValue = 'RFM_Customers'[TotalMonetary]
VAR P20 = PERCENTILE.EXC('RFM_Customers'[TotalMonetary], 0.20)
VAR P40 = PERCENTILE.EXC('RFM_Customers'[TotalMonetary], 0.40)
VAR P60 = PERCENTILE.EXC('RFM_Customers'[TotalMonetary], 0.60)
VAR P80 = PERCENTILE.EXC('RFM_Customers'[TotalMonetary], 0.80)
RETURN
    SWITCH(
        TRUE(),
        ISBLANK(_MonetaryValue), BLANK(), -- Handle customers with no purchases
        _MonetaryValue <= P20, 1,
        _MonetaryValue <= P40, 2,
        _MonetaryValue <= P60, 3,
        _MonetaryValue <= P80, 4,
        5
    )
Step 3 — Combine & Segment
These will also be calculated columns added to your RFM_Customer_Segments table.
1. Combined RFM Score (e.g., 555 = Champion)
This combines the 3 individual scores into a single number for easier grouping.
RFM_Score_Combined =
'RFM_Customers'[R_Score] * 100
+ 'RFM_Customers'[F_Score] * 10
+ 'RFM_Customers'[M_Score]
2. RFM_Segment
This assigns a meaningful name to each customer based on their RFM scores.

RFM_Segment =
VAR R = 'RFM_Customers'[R_Score]
VAR F = 'RFM_Customers'[F_Score]
VAR M = 'RFM_Customers'[M_Score]
RETURN
    SWITCH(
        TRUE(),
        ISBLANK(R) || ISBLANK(F) || ISBLANK(M), "No Purchase Data", -- Customers with no sales records will have blank scores

        // -- Core Segment Definitions (Adjust these rules as per YOUR business logic and customer behavior) --

        // Champions: Bought recently, buy often, spend the most
        (R = 5 && F = 5 && M = 5) || (R = 5 && F = 4 && M = 5) || (R = 5 && F = 5 && M = 4) || (R = 4 && F = 5 && M = 5), "Champions",

        // Loyal Customers: Buy often, relatively recent, good spenders
        (R >= 4 && F >= 4 && M >= 3), "Loyal Customers",

        // Promising: Recent, good spend, but not frequent yet
        (R >= 4 && F <= 3 && M >= 3), "Promising",

        // New Customers: Very recent, but low frequency/monetary (just started)
        (R = 5 && F <= 2), "New Customers",

        // At Risk: Used to be good, but recency is dropping. High frequency/monetary in the past.
        (R <= 3 && F >= 4 && M >= 4), "At Risk",

        // Can't Lose Them: Very valuable in the past but haven't bought recently. Need immediate re-engagement.
        (R <= 2 && F >= 4 && M >= 4), "Can't Lose Them",

        // Hibernating: Last purchase some time ago, bought few, spent little. Potentially awakening.
        (R >= 3 && F <= 3 && M <= 3), "Hibernating",

        // Lost: Bought long ago, bought few, spent little. Lowest value customers.
        (R <= 2 && F <= 2 && M <= 2), "Lost",

        "Other / Uncategorized" -- Catch-all for any combinations not explicitly covered
    )
Drill-Down: Timeline
Average Customers Per Day in Month
This measure shows the average number of unique customers per day for the month and year you’ve selected. It’s calculated across all days in that period, so in your chart, the value will stay the same for every day of the week.

customers_per_day_in_month = VAR SelectedMonthName = SELECTEDVALUE('w fiscalcalendar_cl'[month_name_cl]) VAR SelectedFiscalYear = SELECTEDVALUE('w fiscalcalendar_cl'[fiscal_year]) VAR SelectedCampaignName = SELECTEDVALUE('w campaignskey'[campaign_name]) // Ensure this matches your campaign slicer field VAR AllDatesInSelectedPeriod = CALCULATETABLE ( VALUES ( 'w fiscalcalendar_cl'[date] ), -- Get all unique dates -- Explicitly remove ALL filters from both tables first REMOVEFILTERS ( 'w fiscal_calendar_cl' ), REMOVEFILTERS ( 'w campaigns_key' ), -- Then, reapply ONLY the filters coming directly from your slicers: 'w fiscal_calendar_cl'[month_name_cl] = SelectedMonthName, 'w fiscalcalendar_cl'[fiscal_year] = SelectedFiscalYear, 'w campaignskey'[campaign_name] = SelectedCampaignName ) VAR DailyCustomerCountsForBaseline = ADDCOLUMNS ( AllDatesInSelectedPeriod, "DailyDistinctCustomers", CALCULATE ( DISTINCTCOUNT ( 'w salesdetail_cl'[customer_id] ) ) ) VAR SumOfDailyDistincts = SUMX ( DailyCustomerCountsForBaseline, [customers_active] ) VAR CountOfDays = COUNTROWS ( DailyCustomerCountsForBaseline ) RETURN DIVIDE ( SumOfDailyDistincts, CountOfDays, 0 )Customers In A Day of Week
This measure sums the unique customers for each individual day that falls on the same weekday — for example, all Tuesdays in your selected month.
customers_sum_individual_weekday = SUMX( VALUES('w fiscal_calendar_cl'[date]), // Iterates through each specific date (e.g., each Tuesday date) CALCULATE(DISTINCTCOUNT('w sales_detail_cl'[customer_id])) // Counts unique customers for that specific date )Count Days In Total
Counts how many times a specific weekday (e.g., Tuesday) occurs in the selected month and year.
days_total = COUNTROWS('w fiscal_calendar_cl')Average Customers Per Specific Weekday
customers_per_specific_weekday = DIVIDE( [customers_sum_individual_weekday], [days_total], 0 // Returns 0 if there's no data or division by zero )Time to First Purchase
customers_avg_days_first_purchase =
AVERAGEX( -- Iterate over each unique customer that has sales data SUMMARIZE( 'w sales_detail_cl', 'w sales_detail_cl'[customer_id] ),

VAR CurrentCustomerID = 'w sales_detail_cl'[customer_id] -- Get the member join date for the current customer

VAR MemberJoinDate =
CALCULATE( MAX('w customer_profiles_cl'[member_since]),
REMOVEFILTERS('w sales_detail_cl') -- Clear sales detail filters to find the join date for the current customer ) -- Find the earliest sales date for the current customer

VAR FirstPurchaseDate =
CALCULATE( MIN('w sales_detail_cl'[sales_date]), 'w sales_detail_cl'[customer_id]
= CurrentCustomerID, REMOVEFILTERS('w customer_profiles_cl') -- Clear customer profile filters ) -- Calculate the difference in days

RETURN IF( NOT ISBLANK(MemberJoinDate) && NOT ISBLANK(FirstPurchaseDate), DATEDIFF(MemberJoinDate, FirstPurchaseDate, DAY), BLANK() -- Return BLANK if join date or first purchase date is missing ) )
3. Marketing Analysis
Marketing Metrics
Total Revenue by Campaigns
X axis: promo_type_used
Y axis: revenue_total = SUM('a sales_detail_cl'[item_subtotal_cl]
Total Transactions by Campaigns
X axis: promo_type_used
Y axis: transaction_total = DISTINCTCOUNT('a sales_detail_cl'[transaction_id])
Average Order Value
aov_avg_order_value = DIVIDE([revenue_total],[transaction_total],0)Average Order Value by Campaigns
X axis: promo_type_used
Y axis: avg_order_value = DIVIDE([revenue_total],[transaction_total],0)
-- AOV Lifetime value ## comparing with aov campaign filtered
aov_avg_order_value_nofilter = CALCULATE( DIVIDE([revenue_total],[transaction_total],0), ALL('w sales_detail_cl') ) KPI CARD Value: aov_avg_order_value Trend: promo_type_used Target: aov_avg_order_value_nofilterTotal Marketing Spend
Ad Spend = Money spent to show the ads.
Operational Cost = Money spent to create and manage the campaign and the marketing function.
marketing_totalspend = SUM('w marketing_campaigns_cl'[estimated_ad_spend_cl]) + SUM('w marketing_campaigns_cl'[estimated_operational_cost_cl])Total Marketing Spend (no filter)
marketing_totalspend_nofilter = CALCULATE([marketing_totalspend],ALL('w marketing_campaigns_cl'))Total Marketing Spend (for value on KPI card)
marketing_totalspend_KPI_total = CALCULATE( [marketing_totalspend], ALLSELECTED('w fiscal_calendar_cl'[fiscal_year]), -- or whatever date column you're using for 2024/2025 ALLSELECTED('w campaigns_key'[campaign_name (groups)]) -- or whatever campaign column )ROAS

roas = DIVIDE([revenue_total],[Monthly Allocated Ad Spend for ROAS]) --- Monthly Allocated Ad Spend for ROAS = DIVIDE([Ad_spend_Overall_Fiscal_Year] * [revenue_total], [Revenue_Total_Overall_Fiscal_Year], 0)Customer Acquisition Cost (CAC)
Total Marketing Spend / Number of New Customers Acquired

CAC = DIVIDE([marketing_totalspend], [customers_newjoin], 0)
Contact Completion Rate
-- to check if we can contact with customers about ongoing campaigns contact_completion_rate = DIVIDE(SUM('w customer_profiles_cl'[contact_completed]), [customers_total],0)4. Product Analysis
Product Metrics
Total Revenue
product_revenue_total = SUM('w sales_detail_cl'[total_amount_cl])
-- The difference between product_revenue_total and transacton_revenue_total is transaction already have discounts + other promotions, while product_revenue_total is calculated based on product's price.
Total Product Quantity
product_quantity_total = SUM('w sales_detail_cl'[quantity])Average Size Order
aso_avg_size_order = DIVIDE([product_quantity_total],[transaction_total],0) product_quantity_total = SUM('w sales_detail_cl'[quantity]) transaction_total = DISTINCTCOUNT('w sales_detail_cl'[transaction_id])Sometimes called Average Basket Size (ABS) — measures how many items a customer buys in a single order.
Formula: Total Units Sold ÷ Total TransactionsThink of it as the “how much did they grab on this trip?” metric. It’s not about what they bought — just the count. And that count tells you a lot:
Cross-selling: Did that “Would you like fries with that?” actually work?
Bundling: Are your meal deals getting customers to take more?
Promotions: Is “Buy 2, get 1 free” moving more items per transaction?
How to Put ABS to Work
The magic happens when you compare it:
Before vs. After Campaigns → See if promos actually made baskets bigger.
By Customer Segment → Do loyalty members buy more items per visit than first-timers?
By Channel → Are delivery customers adding fewer sides than dine-in?
Over Time → A slow drop in ABS could mean upselling is slipping — or prices are pushing people to buy less.
Against AOV (Average Order Value) → Bigger baskets don’t always mean higher spend; sometimes people add more low-priced items.
Used well, ABS becomes more than a number — it’s a quick read on whether your sales tactics are nudging behavior in the right direction.
Average Selling Price per Unit
product_price_avg = DIVIDE([product_revenue_total],[product_quantity_total],0)Total Product Cost
product_total_cost = SUMX( 'w sales_detail_cl', // Iterate over each row in the sales detail table 'w sales_detail_cl'[quantity] * RELATED('w product_catalog_cl'[base_price]) )Product Quantity Sold Monthly
product_quantity_current_mtd = CALCULATE(SUM('w sales_detail_cl'[quantity]), DATESMTD('w sales_detail_cl'[sales_date]))Product Quantity Sold Same Period Last Year
product_quantity_sameperiod_lastyear = CALCULATE( [product_quantity_total], -- Your base measure (e.g., Total Quantity) SAMEPERIODLASTYEAR('w fiscal_calendar_cl'[date]) -- Your date column from your calendar table )Average Size Order Monthly
aso_avg_size_order_mtd = CALCULATE([aso_avg_size_order],DATESMTD('w sales_detail_cl'[sales_date]))Average Size Order Same Period Last Year
aso_avg_size_order_sameperiod_lastyear = CALCULATE( [aso_avg_size_order], -- Your base measure SAMEPERIODLASTYEAR('w fiscal_calendar_cl'[date]) -- Your date column from your calendar table )We’re approaching the final act of this Data × Design Series.
Next: [Ep 8] PHASE 5: The Story — Visualizing the Insights. Here, I chase the “why” behind the numbers, reveal the hidden logic in the data, and turn calculations into clear, visual insights.
💡 Part of my Data × Design Series — follow the journey from raw interview challenge to polished dashboards.
![[Ep 8] PHASE 5: The Story — Visualizing the Insights](https://static.wixstatic.com/media/11062b_545b5c6587ab4b3aaab475ffce44b3f5~mv2.png/v1/fill/w_980,h_395,al_c,q_90,usm_0.66_1.00_0.01,enc_avif,quality_auto/11062b_545b5c6587ab4b3aaab475ffce44b3f5~mv2.png)
![[Ep 6] PHASE 3: Creating Relationships](https://static.wixstatic.com/media/11062b_c682a65f403041f1a17a267378fa9170~mv2.png/v1/fill/w_980,h_408,al_c,q_90,usm_0.66_1.00_0.01,enc_avif,quality_auto/11062b_c682a65f403041f1a17a267378fa9170~mv2.png)
![[Ep.1-2] The Technical Interview That Turned Into a Data Analytics Masterclass](https://static.wixstatic.com/media/ead171_dd3b799463944bc49518a4345d770e4b~mv2.jpg/v1/fill/w_980,h_668,al_c,q_85,usm_0.66_1.00_0.01,enc_avif,quality_auto/ead171_dd3b799463944bc49518a4345d770e4b~mv2.jpg)
Comments